The opponent page brings the season data of two teams together in the same layout before a game. You pick your team once on the home page, and the page finds the opponent from the next game in the fixture list. From top to bottom it has a game card, standout matchups, the opponent’s style, players, matchup detail, rotation and form. The interactive dashboard is on the TBL Vision page. It is in Turkish, so I give the English meaning of the labels I quote.
In this post I explain what to look at in each section. The examples come from Ormanspor vs Darüşşafaka, played on 31 October. The numbers are from 29 October, when eight weeks and 64 games of the season had been played.
No section of the page tells you what to do. It shows which tendencies have repeated over the season and how far they can be trusted, and it leaves the decision to the coach.
Check the data strength first
Each measure on the page carries one of three marks. ● means the measure has settled: after eight games it mostly reflects the team itself. ◐ means it has partly settled. ○ means the number still depends mostly on luck.
These marks come from a measurement. For each measure I checked whether the difference between teams is larger than the game-to-game variation of the same team. If it is, the measure gets a ●. Pace and where the shots come from are clear after eight games. The three-point percentage a team allows is still almost entirely luck at that point.
So before looking at how big a number is, look at its mark. A large difference marked ○ tells you less than a small one marked ●.
The game card gives a range, not a score
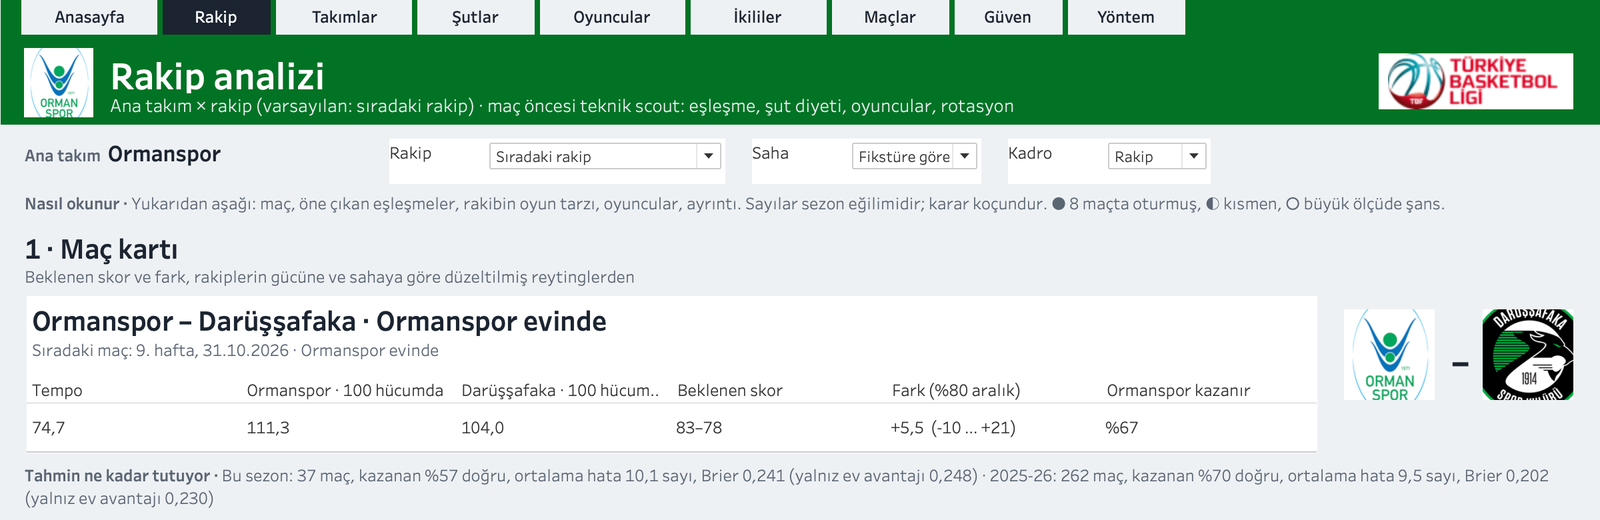
The game card turns the two teams’ season ratings into an expectation for this game. The ratings are adjusted for opponent strength and venue, so a team that played an easy schedule is pulled down a little and one that played a hard schedule is pulled up.
The most important line on the card is the 80% range. In the example the expected margin is 5.5 points for Ormanspor, and the range runs from -10 to +21. If these two teams met ten times at the same venue, eight of the results would be expected to fall in that range. A 10-point Darüşşafaka win and a 21-point Ormanspor win are both inside it. The 67% win probability describes the same uncertainty: Darüşşafaka would win one in three games like this.
The Court (Saha) selector changes the expectation. This season home advantage is worth about 2.3 points a game. If the same game were played at Darüşşafaka’s arena, the expected margin would drop to +0.8 and the win probability to 53%.
The line under the card, “how well does the forecast hold up”, shows the method’s record. Last season it picked the winner in 70% of 262 games. In the first 37 games of this season the rate was 57%. Early in a season there is little information about the teams, so read the card together with that line.
Standout matchups

This section looks at the four factors (shooting, turnovers, offensive rebounds and free throws) for each team’s offense. That gives eight matchups, and the page shows three of them as cards. The fourth card shows the opponent player who uses the most possessions.
Every card reads the same way. The first card in the example covers free throws when Ormanspor have the ball:
| On the card | Meaning |
|---|---|
| Free throws (FTM per shot) · Ormanspor on offense | The topic and the team on offense. The measure is made free throws per field-goal attempt. |
| Ormanspor: 0.34 · 1st of 17 | Ormanspor’s season value. 1st means the highest value in the league. |
| Darüşşafaka defence: 0.24 · 6th of 17 | The value Darüşşafaka allow their opponents, and its league rank. |
| League avg. 0.23 · combined 0.37 | The league average, and the value expected when the two tendencies meet. |
| Tendency: +3.7 pts per 100 poss., toward Ormanspor | What this factor adds to the margin if both tendencies hold in the game. |
| Data strength: medium ◐ | How settled the measure is after eight games. |
This season Ormanspor get to the foul line more than any other team in the league. Darüşşafaka allow slightly more free throws than the league average. If both tendencies hold, free throws could be worth about 3.7 points per 100 possessions. In a game of 75 possessions that comes to 2-3 points. The card does not turn this into advice; it only shows what the two teams have done this season and how it could carry into the game.
The size of a tendency alone does not set the order of the cards. The page weighs each tendency by its data strength: a ● tendency counts in full, a ◐ one at 0.6, a ○ one at 0.25. The largest tendency in the example concerns Darüşşafaka’s shooting and reaches 7.1 points per 100 possessions. Because that measure’s data strength is weak, the matchup drops to third. The table below lists all eight matchups. Positive values favour Ormanspor, negative values favour Darüşşafaka. Click the column headers to compare the two orderings.
| Free throws | Ormanspor | 3.7 | medium ◐ | 2.19 |
| Turnovers | Darüşşafaka | -3.2 | medium ◐ | 1.91 |
| Shooting (eFG%) | Darüşşafaka | 7.1 | weak ○ | 1.77 |
| Shooting (eFG%) | Ormanspor | 5.3 | weak ○ | 1.33 |
| Turnovers | Ormanspor | -1.8 | medium ◐ | 1.09 |
| Free throws | Darüşşafaka | -1.7 | medium ◐ | 1.02 |
| Offensive rebounds | Darüşşafaka | 3.3 | weak ○ | 0.83 |
| Offensive rebounds | Ormanspor | 0.5 | weak ○ | 0.11 |
How the opponent plays
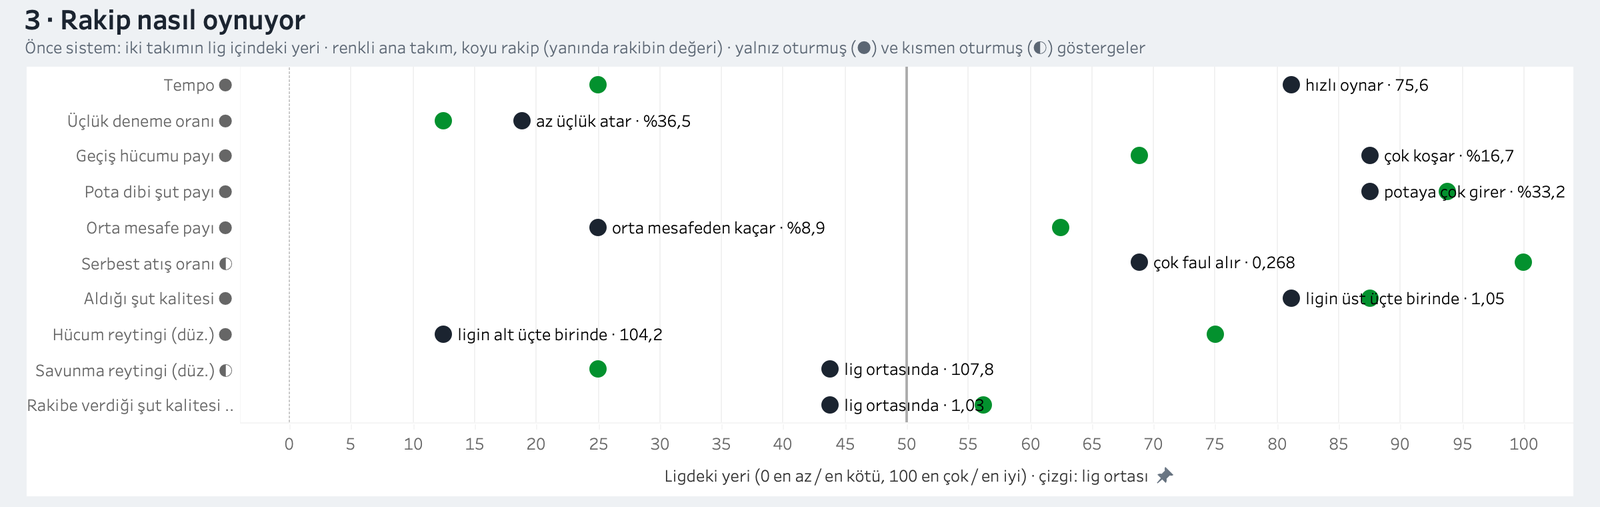
This chart puts the two teams side by side on ten measures. The position of each dot shows the team’s place in the league, where 0 is the lowest value and 100 the highest. Green dots are Ormanspor, dark dots Darüşşafaka. Only measures marked ● or ◐ appear on the chart.
In the example Darüşşafaka, at a pace of 75.6, are among the faster teams in the league. Ormanspor, at 73.4, are on the slower side. The game card’s pace of 74.7 comes from between these two values. Both teams attempt fewer threes than the league average and take about a third of their shots at the rim.
The axis does not mean the same thing on every row. On style rows such as pace and shot shares, the right side shows the highest value. On rating and shot quality rows, the right side is the end that favours the team. Ormanspor’s defensive rating, for example, is 108.6 and sits around 25 on the chart; only four teams in the league allow more points.
The opponent’s standout players

This section shows the opponent’s five players with the most minutes. The tag on the first line of a card appears when the player is in the top 20% of the league’s qualified players on one of six measures. İsmail Karabilen, for example, takes 64% of his shots at the rim, and his card carries the tag “gets to the rim a lot”. The tag “no clear extreme” does not mean a player is unimportant. Mert Ali Sert, who plays the most minutes for Darüşşafaka, has that tag on his card.
The ± on the accuracy line shows the range the player’s true level most likely falls in. “TS 53% ±5” means the true value is expected to be between 48 and 58. The values on the cards are not raw but blendedThis season's value is combined with last season's value and the league average, weighted by the number of attempts. With few attempts the value is pulled toward the league average. values.
Josh Sharkey’s three-point shooting shows the difference well. This season Sharkey has made 14.8% of his 27 three-point attempts. Last season the rate was 31.2%. The blended value comes out at 31.6%, which is why the card shows “3P 32% ±5”.
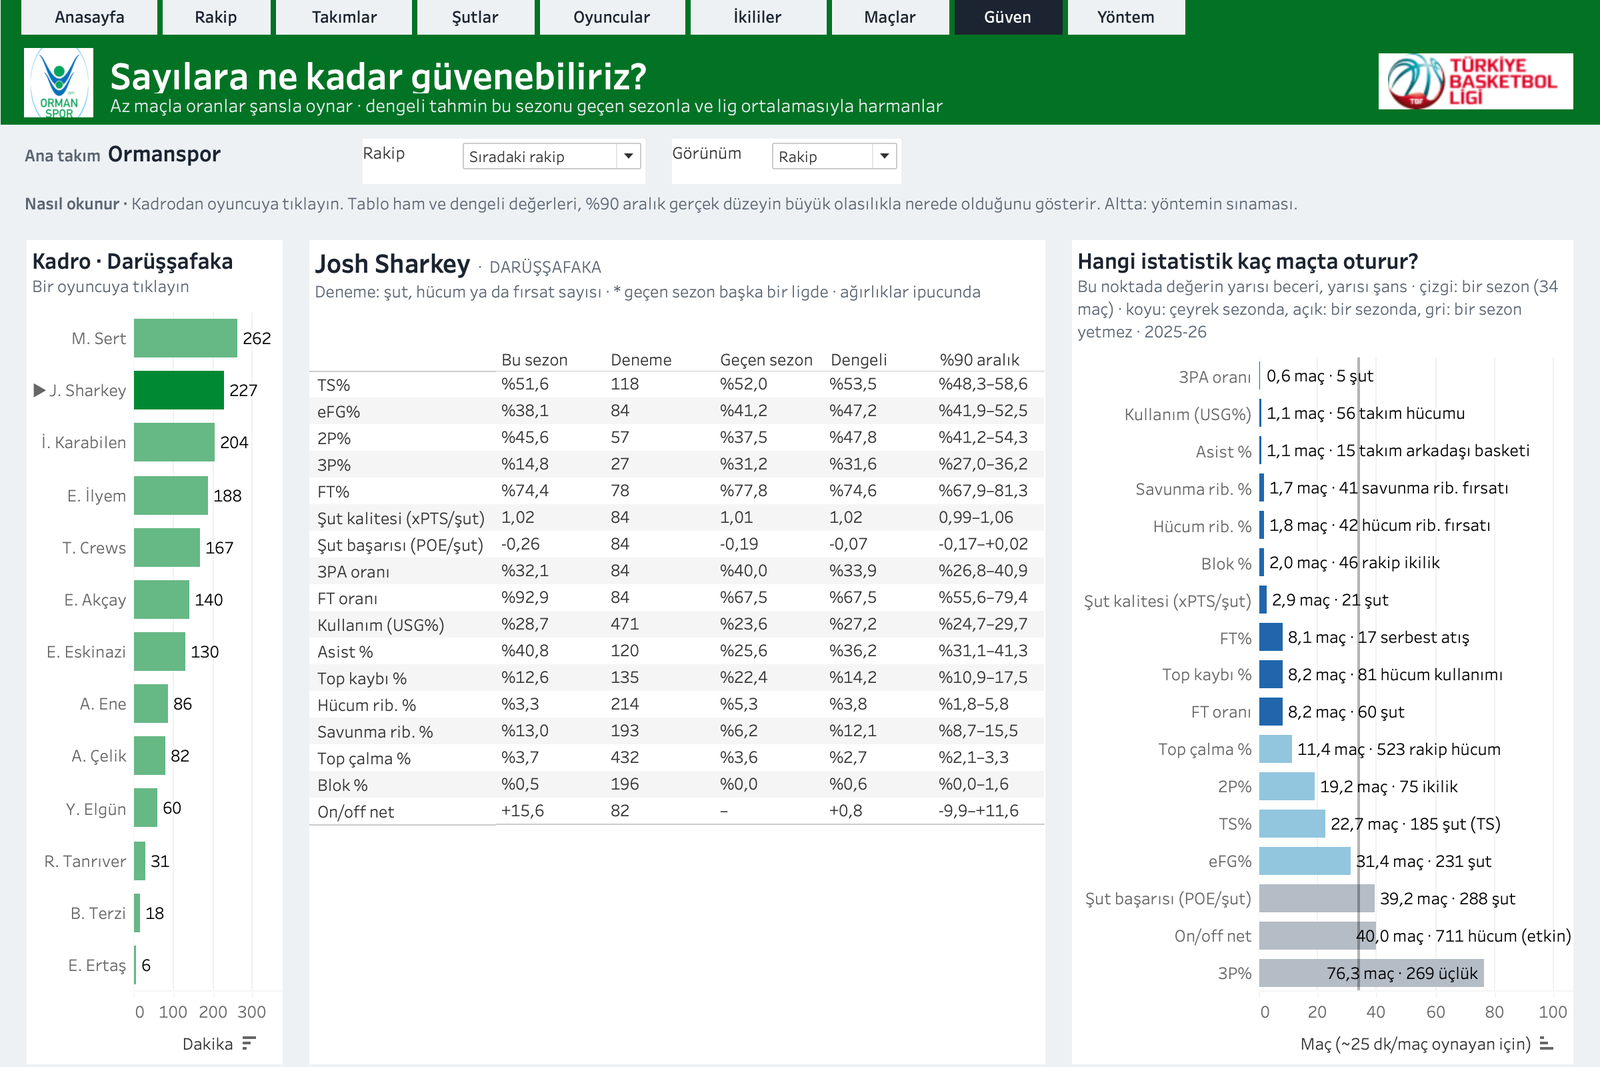
The value is adjusted this much because three-point percentage is a stat that settles very late. Using last season’s data, I calculated for each player stat how many games it takes before a value is half skill and half luck:
| 3PA rate | 0.6 games |
|---|---|
| Usage | 1.1 games |
| Assist % | 1.1 games |
| Shot quality | 2.9 games |
| FT% | 8.1 games |
| TS% | 22.7 games |
| Shot-making | 39.2 games |
| 3P% | 76.3 games |
Three-point attempt rate settles in one game, usage and assist rate in two. Three-point percentage takes 76 games, more than two seasons. How much a player shoots and how much he has the ball becomes clear within a few games. How accurate he is on those shots takes much longer to learn. That is where the cards’ “usage ● · accuracy ◐” split comes from.
Matchup detail
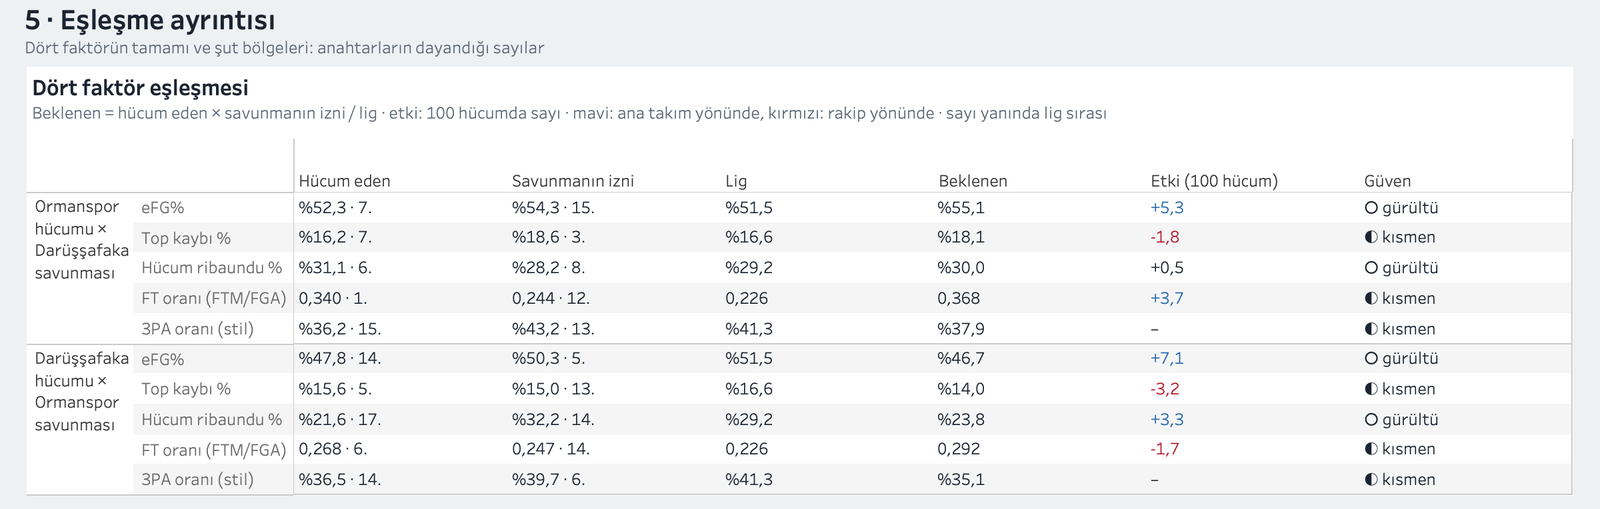
This table shows all the calculations behind the matchup cards. Every row computes the expected value the same way: the offense’s value is multiplied by the value the defence allows and divided by the league average.
In the example Ormanspor’s effective field goal percentage (eFG)eFG%: a shooting percentage that counts the extra value of a three. is 52.3%, Darüşşafaka allow 54.3%, and the league average is 51.5%. That makes Ormanspor’s expected eFG 55.1%. The 3.6 points above the league average are worth about 5.3 points per 100 possessions.
This row’s data strength is ○, though. The 54.3% Darüşşafaka allow depends mostly on how well their last eight opponents shot in those games. Move the slider to see how the expectation changes with that value:
If Darüşşafaka allow 54.3%, Ormanspor’s expected eFG is 55.1%, and the tendency is +5.3 points per 100 possessions.
With the slider at the league average (51.5%), the tendency drops to +1.0. Most of the table’s +5.3 tendency therefore comes from a number that has not settled after eight games.
The ranks in this table count in a different direction from the cards. On the cards, 1st is the highest value in the league. In this table, 1st is the value that most favours the team on that row. Darüşşafaka’s 15.6% turnover rate, for example, shows as “13th of 17” on the card and “5th” in this table.
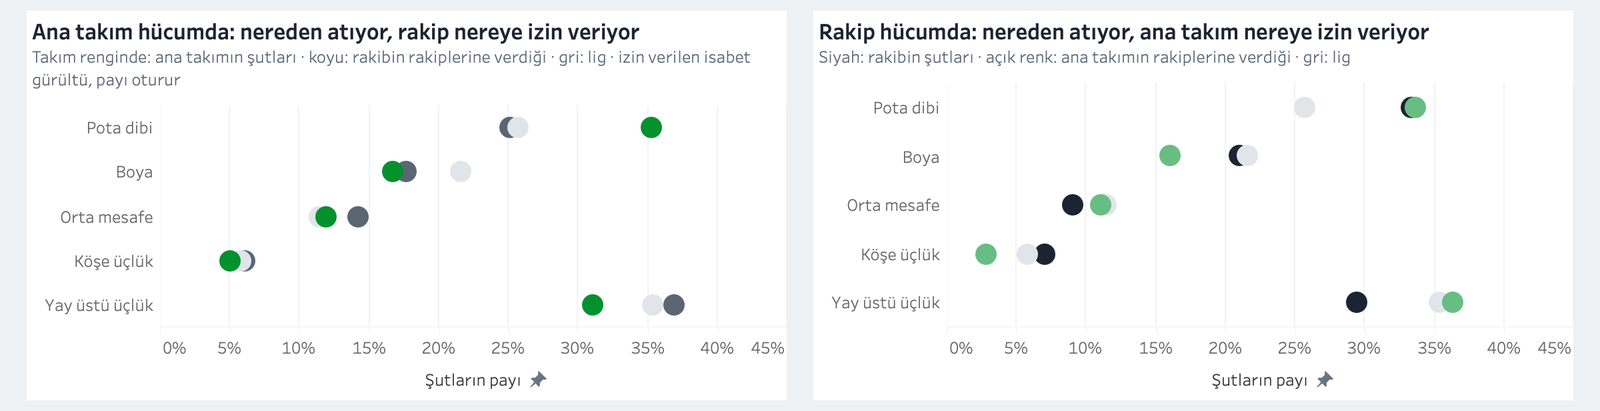
The two charts under the table show which zones the shots come from. For each zone they put the team’s share of shots, the share the opponent allows and the league average side by side. In the example Ormanspor take 35% of their shots at the rim, against a league average of 25.7%. Darüşşafaka allow a league-average share of shots at the rim.
On these charts, look at the shares. Where a shot is taken settles in eight games, but how often the opponent makes shots from that zone does not. The full shot map is on the Shots (Şutlar) page; with View (Görünüm) set to the opponent, the map shows the opponent’s shots.
Rotation and lineups
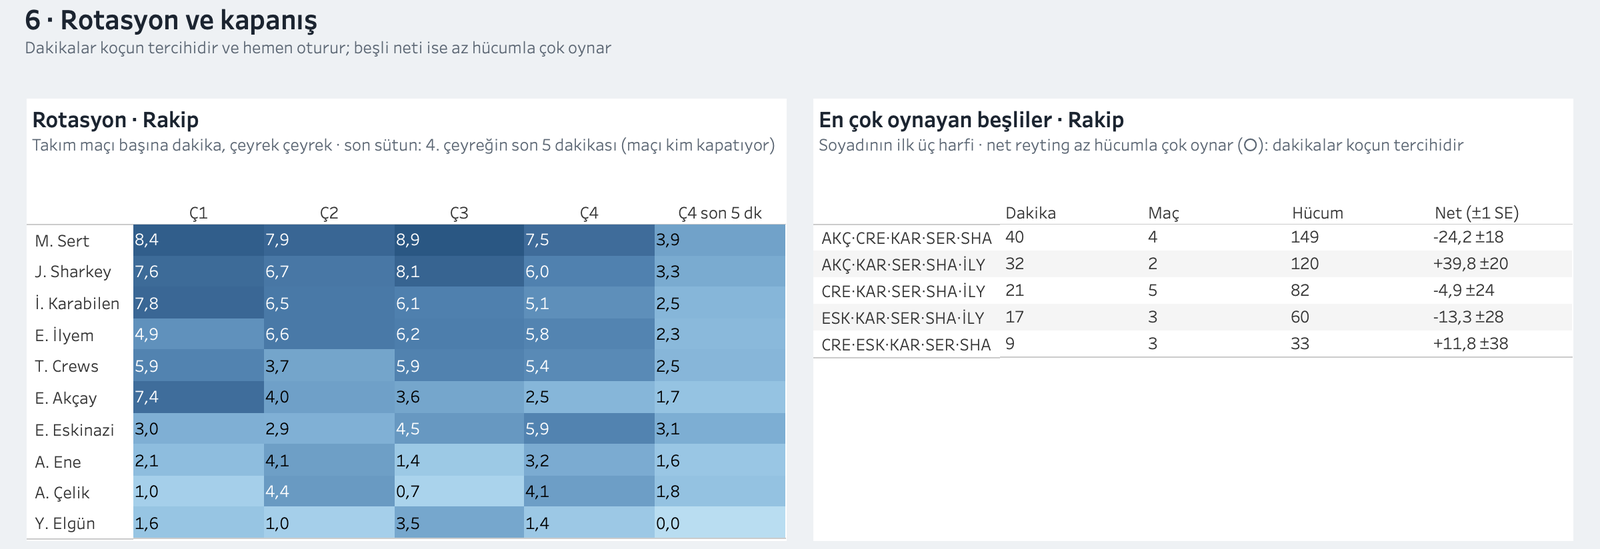
Minutes are the coach’s choice, so they become clear within a few games. That makes the rotation section one of the most reliable parts of the page. Each cell of the heat map shows how many minutes per game a player plays in that quarter. The last column gives the final five minutes of the fourth quarter separately. In the example Ege Akçay has started all eight games, but his minutes drop to 2.5 in the fourth quarter. Ege Eskinazi’s minutes grow as the game goes on; in the final five minutes only Sert and Sharkey play more.
The net ratings in the lineup table need more care. In the example the most-used lineup has a net rating of -24.2 over 149 possessions, with a standard error of ±18. Over so few possessions a run of a few minutes can easily move the result by 20-30 points. So in this table, look first at how long each lineup has played together.
Form and past meetings
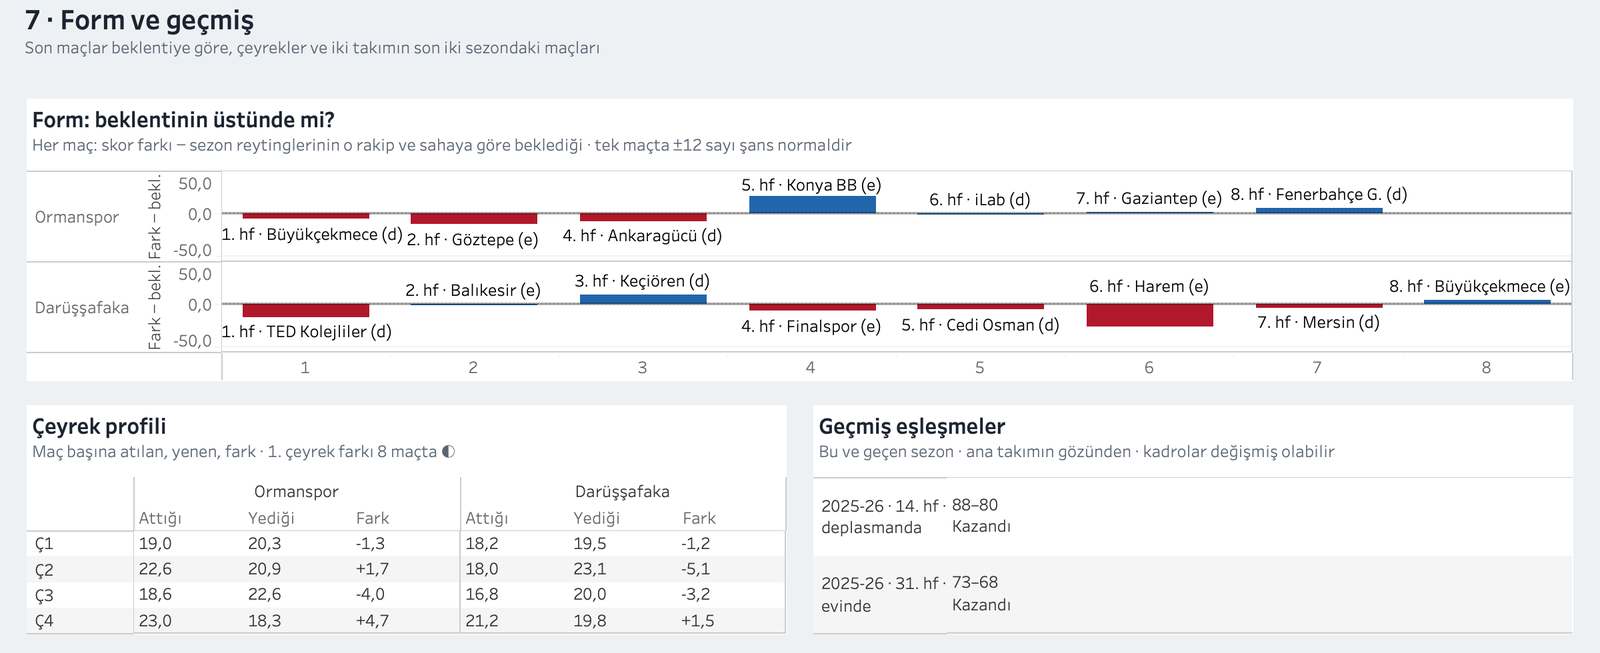
The form chart takes each game’s margin and subtracts the margin the season ratings expected. A bar above the line means the team won by more than expected. A swing of ±12 points in a single game is ordinary, so bars inside that band do not show a tendency on their own. In the example Darüşşafaka’s game against Harem (47–79) came in 26.7 points below expectation, clearly outside that band.
The quarter profile needs the same care. In the example Ormanspor lose third quarters by 4.0 points a game and win fourth quarters by 4.7. Only the first-quarter margin is marked ◐, though; the other quarters are mostly luck after eight games. The past meetings section lists the two teams’ games over the last two seasons. Rosters may have changed since, so read those results as information, not as a tendency.
In short
You can open the dashboard on the TBL Vision page and try it with your own team.